Graphic Organizers

Story Map
a visual organizer that helps a reader understand a work of literature by tracking setting,
Also is a way to tell the sequence of a story.

The Venn Diagram is used to set the difference of two subjects and the middle portion is where
the similarities will be placed

This K-W-L Chart, which tracks what a student knows (K), wants to know (W), and has learned (L) about a topic, can be used before, during, and after research projects.
Cause-Effect Tree
This strategy helps students identify cause and effect relationships. It is important to stress that sometimes one cause may have several effects, or several causes may lead to one effect. There is not always a one-to-one relationship in cause and effect.
Five Paragraph Organizer
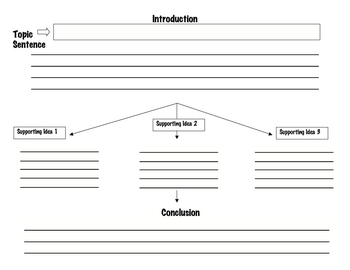
Help students write five-paragraph essays with a graphic organizer.
Read more on FamilyEducation:http://www.teachervision.fen.com/graphic-organizers/printable/43086.html#ixzz2DsicSspz
Brainstorming Web
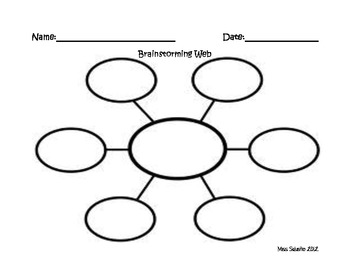
Analyzing Attributes/Brainstorming Use to list facts, definitions, attributes, or examples related to a single topic, concept, or theme. May also be used to compare and contrast information generated on left and right sides of web
Use to show a system of persons or things ranked one above another, left to right; use in the beginning of a project to visually arrange interrelated and sequentially ordered sections within the whole, similar to an outline; subjects that lend themselves to this organizer are: projects (web sites), term papers, organizations (government or company), systems (body or machine), etc

T-Charts are a type of chart, a graphic organizer in which a student lists and examines two facets of a topic, like the pros and cons associated with it, its advantages and disadvantages, facts vs. opinions, etc.

This charts will help students understand place-valu
No comments:
Post a Comment